A/B Testing PM Interview: The Facebook Reactions Rollout Decision
Welcome back to PM Interview Prep Weekly! I’m Ajitesh, and this week we’re returning to A/B testing—but with a twist. Instead of optimizing an existing feature for revenue, we’re testing whether to launch a completely new feature that could fundamentally change how billions of people express themselves online.
The Context
For years, the “Dislike” button was the most requested feature on Facebook. Users wanted it desperately. They wanted to express disapproval, show empathy for sad posts, or simply disagree with content.
And for years, Facebook said no.
If you were a PM at Facebook, adding a Dislike button would have been a nightmare. Think about the consequences: promoting hate and negativity, discouraging people from posting (who wants to get disliked?), and feeding the algorithm with negative signals that could create toxic spirals. The feed algorithm would amplify what gets engagement—imagine a world where controversial, anger-inducing posts get the most Dislikes and therefore the most distribution.
The social product landscape of the early 2010s was pretty simple. Most platforms had one reaction—Facebook had Like, Twitter had favorites (later hearts), Instagram had hearts. The only exception was Reddit and a few forums that used upvote/downvote systems, but those worked in anonymous or pseudonymous contexts. Downvoting someone on Reddit felt different because it wasn’t personal. On Facebook, with real names and your actual friends, a Dislike could feel like a punch in the face.
So Facebook had a dilemma: users clearly wanted more expressive options, but the obvious solution (Dislike) would likely destroy the platform’s positive culture.
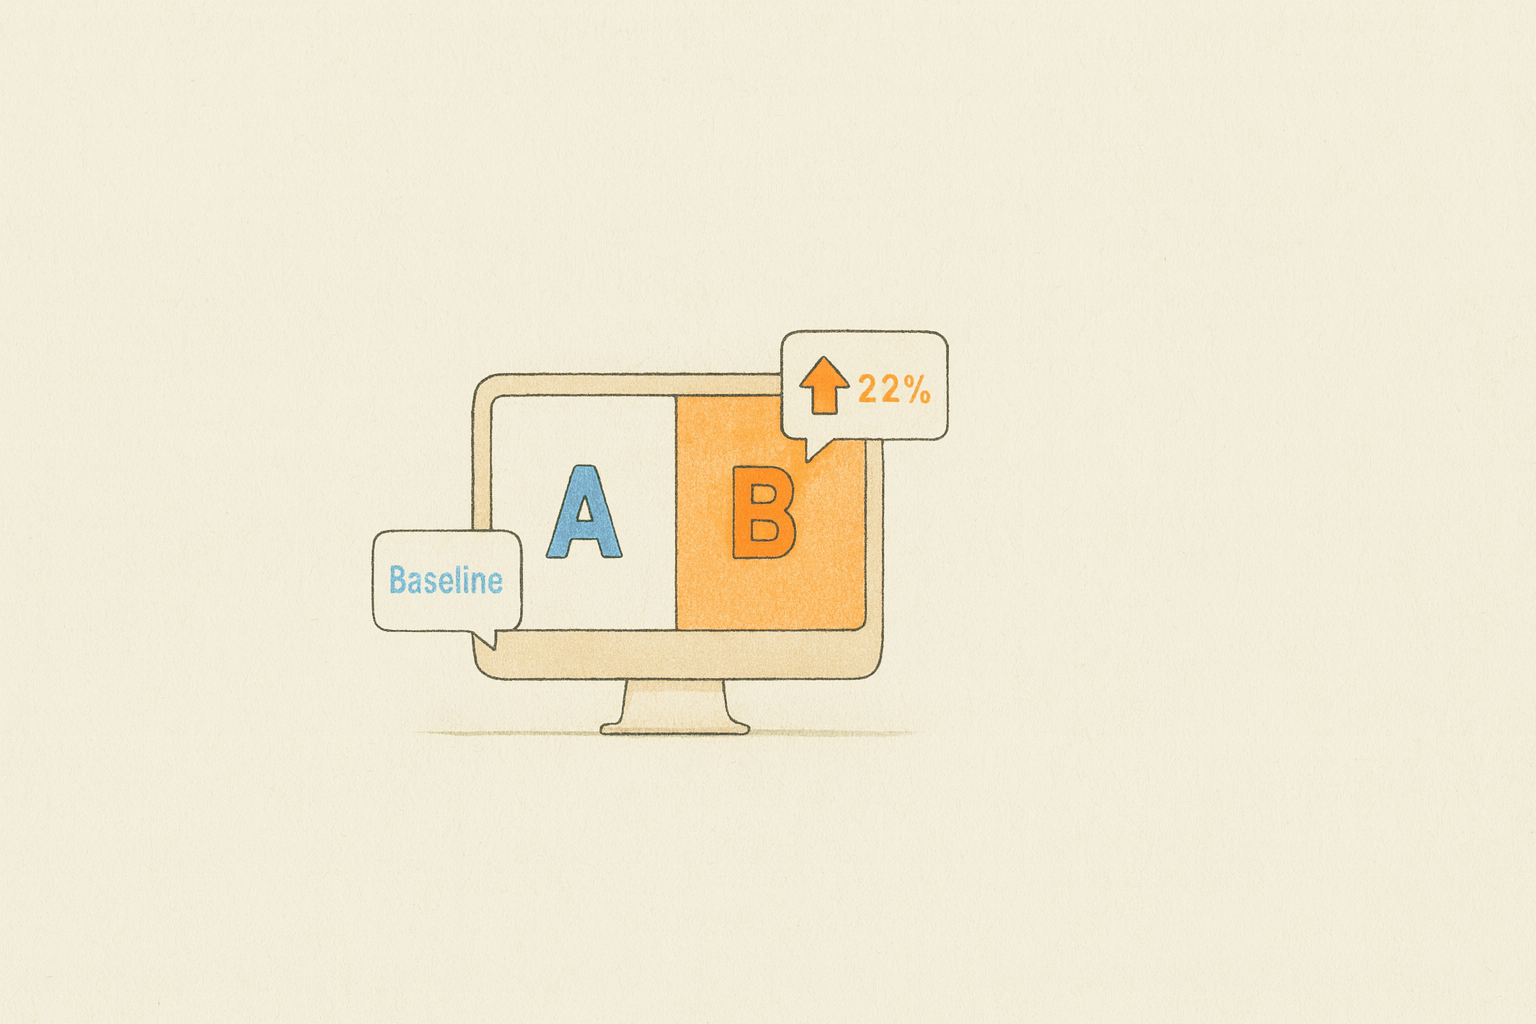
This is the classic case where A/B testing becomes absolutely critical. The thing is—adding new reaction buttons is technically trivial. A few weeks of engineering work, maybe a month. But the chance of getting it wrong? Catastrophic. Wasted dollars, engagement collapse, user exodus, creator backlash.
It’s like the famous example of changing a button color in Google Search—technically, it’s a one-line code change. But should you do it? Which color? How do you know it won’t tank click-through rates or user satisfaction?
This is what makes A/B testing so powerful: when the implementation is easy but the decision is hard.
The Evolution to Reactions:
By 2012, Facebook’s product team had been wrestling with this for years. Through extensive user research, they discovered something crucial: users didn’t actually want to express negativity toward posts—they wanted to express appropriate emotions. They wanted to show empathy when a friend shared sad news. They wanted to express love more strongly than a simple Like. They wanted to react with surprise or humor.
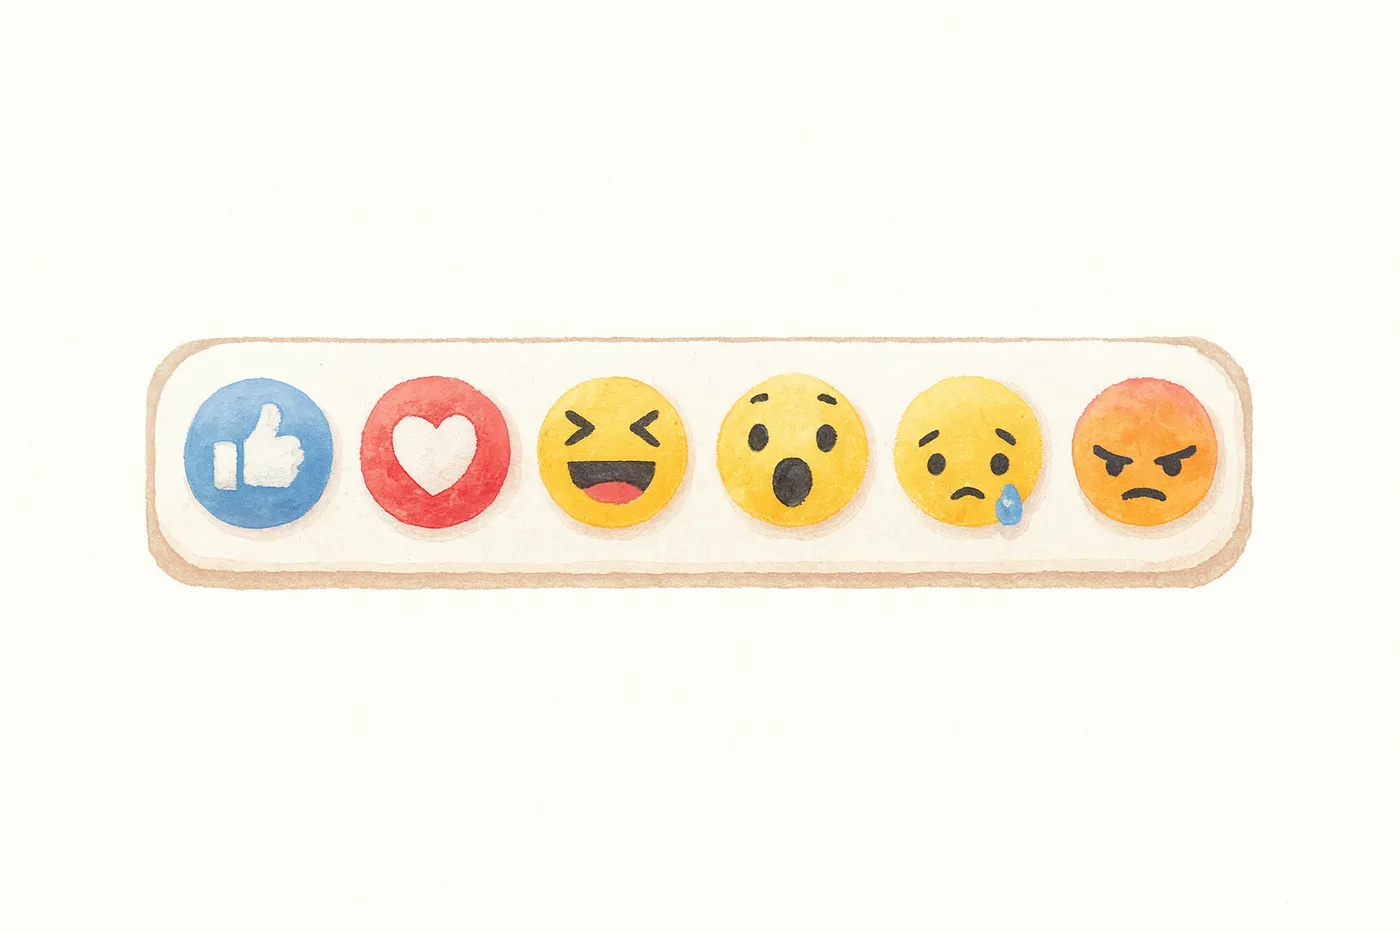
The solution they eventually landed on (after years of testing) was Reactions: Love, Haha, Wow, Sad, and Angry. Notice what’s clever here—these aren’t “Dislike.” Sad and Angry aren’t reactions to the post; they’re expressions of emotion about the content. You’re not saying “I dislike that your grandmother died”—you’re saying “This news makes me sad.”
This distinction was everything.
A personal observation: I remember when Reactions launched in 2016. I was at Fitso at the time, building our own social fitness feed. We watched Facebook’s rollout obsessively. Should we add reactions to workout posts? Would it increase engagement or create complexity?
What fascinated me was how careful Facebook was. They didn’t just add Reactions globally overnight. They tested in select markets (Spain and Ireland first, I recall), iterated on the emotion set (they tried many different combinations), and carefully measured not just engagement but sentiment accuracy and user satisfaction.
A PM friend who worked adjacent to the Reactions team later told me something that stuck with me: “Our biggest fear wasn’t that Reactions would fail—it was that they would succeed in the wrong way. What if Angry reactions dominated everything? What if people used Haha to mock serious posts? We weren’t just testing a feature; we were testing whether billions of people could be trusted with more expressive tools.”
The Setup: You’re a PM at Facebook in 2012. Your UX research team has built the first MVP of Reactions—users can now express Love, Haha, Wow, Sad, and Angry in addition to Like. The prototype works. The designs are ready. The code is written.
But here’s the critical question: Should you launch it?
The Question: Today we’re tackling: “You have the Reactions MVP ready to be rolled out. How would you decide whether to rollout? Setup an A/B test. What metrics would you use to make the decision?”
This is different from our previous A/B testing case about Facebook Ads revenue. That case was about optimizing existing systems for revenue. This is about validating whether a fundamentally new interaction pattern should exist at all.
Approach to Solving A/B Testing Questions
If you read newsletter on A/B Testing for Facebook Ads Revenue, this framework will feel familiar. That’s intentional—A/B testing methodology is remarkably consistent across different problem types.
Whether you’re optimizing revenue, testing new features, or evaluating UX changes, the core approach remains the same. What changes is the specific metrics you track and the biases you need to watch for.
The Three-Step Framework:
Step 1: Define Your Hypotheses
Every A/B test starts with a clear hypothesis pair:
Null Hypothesis (H₀): In A/B testing, the null hypothesis states that there is no difference between the control and variant group. This is your default assumption until proven otherwise.
Alternative Hypothesis (H₁): The alternative hypothesis states that there is a measurable difference between the control and variant group. This is what you’re trying to prove.
The goal is to determine whether to reject the null hypothesis in favor of the alternative with statistical significance.
Step 2: Apply the PICOT Methodology
The PICOT framework, commonly used in healthcare research, adapts perfectly to structure A/B testing approaches:
- Population: Target audience for the test (e.g., mobile app users)
- Intervention: The change or variant being tested relative to the control—a measurable product change like adding new reaction types
- Comparison: Existing product without any change (the control group)
- Outcome: The key metrics that define intervention impact. These become your main evaluation criteria and often represent the most critical part of the interview
- Time: Duration for running the experiment before analyzing data and reaching conclusions
Example Application: P (global Facebook users on mobile), I (6 reaction types accessible via long-press), C (Like-only experience), O (total engagement actions, sentiment accuracy), T (6 weeks).
Step 3: Watch for Biases and Statistical Significance
When analyzing A/B testing results, several critical considerations emerge:
Novelty Effect: Users may engage more with new features initially due to curiosity. For Reactions specifically, users might experiment heavily with all the new options in the first few weeks, inflating engagement metrics artificially.
Primacy Effect: Long-time Facebook users have trained themselves on the Like button for years. They may resist the complexity of choosing between six options, preferring the simplicity they know.
Network Effects: Unlike many A/B tests, social products have a unique challenge—your treatment group’s behavior is visible to your control group. If someone in the test group uses a “Sad” reaction, users in the control group see it in their feed, potentially contaminating the control.
Statistical Significance: Determine whether results are statistically significant using p-values. This represents the probability of obtaining results at least as extreme as observed results, assuming the null hypothesis is true. Values range from 0 to 1, with p-values less than 0.05 (5%) conventionally considered statistically significant for accepting alternative hypotheses.
This framework provides structure while leaving room for creative thinking. The critical part is thinking through the right metrics for feature launch decisions and showcasing that you understand the unique challenges of testing new interaction patterns.
The Case Study
Interviewer: “Imagine 2012. No Reactions—only Likes and comments. You are the PM for Likes, working with UXR to build the first version of reactions. You have the MVP ready to be rolled out. How would you decide whether to rollout? Setup an A/B test. What metrics would you use to make the decision?”
My Solution Using the Outlined Approach
Step 1: Clarifying Questions and Context
First, let me share my understanding of the context:
We’re in 2012, and Facebook’s engagement model is simple: users can Like posts (lightweight, one-click) or write comments (heavier, requires thought and typing). The Like button is one of our most successful features—it’s simple, unambiguous, and universally understood.
However, we’ve identified a fundamental limitation through user research: Like is emotionally insufficient. Users struggle to respond appropriately to sad news, serious content, or posts that evoke complex emotions. Commenting requires too much effort for quick emotional expression.
The Reactions MVP introduces five new emotional responses beyond Like: Love, Haha, Wow, Sad, and Angry. Users access these via long-press (mobile) or hover (desktop) on the Like button.
My key assumption: We want to validate that Reactions improve user experience and engagement without introducing negative consequences (confusion, negative sentiment spirals, comment cannibalization).
Clarifying questions I’d ask:
-
Success Definition: Are we primarily optimizing for total engagement volume, or do we care more about sentiment accuracy and user satisfaction with their expression options? (Assume: Balanced—we want both engagement lift AND improved user satisfaction with emotional expression)
-
Rollout Strategy: If the test succeeds, are we planning a global rollout or phased expansion by region? (Assume: Phased rollout starting with select markets if test succeeds)
-
Content Creator Concerns: Have we done any research on how content creators might feel about receiving different reaction types? Could Angry or Sad reactions discourage posting? (Assume: We need to monitor content creation rates as a key guardrail)
Step 2: Hypothesis Formation and Test Design (PICOT)
Problem Statement: Users cannot express nuanced emotions with only the Like button, creating dissonance when responding to sad, serious, or complex emotional content. This limits authentic expression and may reduce engagement on non-positive content.
Hypothesis Formation:
- Null Hypothesis (H₀): Adding Reactions has no effect on user engagement or satisfaction with emotional expression
- Alternative Hypothesis (H₁): Reactions will increase total engagement actions by 10-15% and significantly improve user satisfaction scores for appropriateness of available responses
- Reasoning: Users frequently encounter content where “Like” feels inappropriate (sad news, serious topics). When this happens, they have two options: write a comment or ignore the post entirely. Comments require significant effort—you need to think about what to say, how to frame it appropriately, whether it sounds genuine. And this was 2012, before ChatGPT could help you craft empathetic responses. The cognitive load is high. So most people just… don’t engage at all. They scroll past. This means Facebook loses engagement on a huge volume of emotional content. Reactions solve this brilliantly—they provide a lightweight, appropriate way to acknowledge sad, serious, or emotionally complex posts without the friction of composing a comment.
PICOT Application:
Population:
- Start with 5% of global daily active users (~50 million users)
- Stratified sampling across:
- Regions: US (25%), Europe (25%), Asia (25%), Rest of World (25%) to capture cultural differences in emotional expression
- Devices: Mobile (70%), Desktop (30%) reflecting actual usage patterns
- User tenure: New users (<3 months), Regular users (3-12 months), Power users (>12 months)
Intervention: Six reaction options accessed via long-press (mobile) or hover (desktop) on Like button:
- Like (existing baseline)
- Love (❤️) - stronger positive emotion
- Haha (😂) - humor
- Wow (😮) - surprise
- Sad (😢) - empathy for negative content
- Angry (😠) - frustration or disagreement
Comparison:
- 50/50 split between control and treatment
- Control: Existing Like button + comments only
- Treatment: New Reactions interface
- Critical consideration: Network effect contamination—users in control group will see Reactions from treatment group in their feeds. We’ll need to track this exposure and potentially do subgroup analysis for “pure control” (users who never saw a Reaction) vs “exposed control” (users who saw Reactions but couldn’t use them)
Outcome Metrics:
Primary Metrics (these determine go/no-go decision):
- Total Engagement Actions: (Reactions + Likes + Comments) per user per day
- Target: +10% increase in treatment vs control
- User Satisfaction with Expression Options: Post-interaction survey asking “Could you express how you felt?”
- Target: +15% in “Yes, perfectly” or “Yes, adequately” responses
Secondary Metrics (help us understand behavior):
- Reaction Distribution: What % of each reaction type? (Watch for negative reactions dominating)
- Reaction Adoption Rate: What % of users try Reactions at least once? Daily active users of Reactions?
- Time to Engage: Does choosing from 6 options increase decision time vs simple Like?
Guardrail Metrics (ensure we don’t break things):
- Comment Volume: Comments per post—watch for cannibalization
- Acceptable threshold: <5% decrease (some substitution expected)
- Content Creation Rate: Posts per user per day
- Critical threshold: No decrease >2% (creators might stop posting if they get negative reactions)
- Session Duration: Time spent on Facebook
- Watch for: No significant decrease
Time:
- Duration: 6 weeks total
- Weeks 1-2: Heavy novelty effect expected—users experimenting with all reactions
- Weeks 3-6: Cleaner data as behavior normalizes
- Why 6 weeks?
- Long enough to move past initial novelty and establish patterns
- Captures different behavioral cycles (weekday/weekend, different content rhythms)
- Facebook’s scale means we’ll have statistical significance much earlier, but we want behavioral validity, not just statistical significance
Step 3: Statistical Considerations and Biases
Statistical Significance: With 50 million users per variant, we’ll achieve statistical significance (p < 0.05) within days. However, we’re running 6 weeks to ensure we capture sustained behavior, not just novelty effects.
Critical Biases to Watch:
1. Novelty Effect (Highest Risk) Users will experiment heavily with new reactions in weeks 1-2 just because they’re new. We might see +20% engagement initially that drops to +5% by week 6. Solution: Analyze weeks 3-6 separately and use that data for rollout decisions.
2. Primacy Effect Long-time Facebook users trained on the Like button may resist the complexity of 6 choices. Mitigation: Segment analysis by user tenure to see if power users show lower adoption or frustration.
3. Content Creator Backlash If creators receive mostly Angry or Sad reactions, they might post less. Critical threshold: If content creation drops >2%, this could spiral into network collapse. Monitor posts per user before and after receiving negative reactions.
Key Trade-offs:
Comments vs Reactions: Some users will react instead of commenting “lol” or “so sad.” If comments drop <10% while total engagement increases >10%, that’s a win—Reactions serve a different function.
Negative Sentiment Risk: If Angry + Sad reactions exceed 40% of total reactions, we risk making Facebook feel negative. This needs close monitoring.
Decision Criteria for Rollout:
I would recommend ROLLOUT if:
- Total engagement increases ≥10% in weeks 3-6 (sustained)
- User satisfaction with expression improves
- Content creation remains stable (decline <2%)
- Negative reactions comprise <40% of total
- No DAU decline
I would recommend ITERATE if engagement increases but negative reactions dominate (>40%), or strong primacy effect among power users, or comment cannibalization >15%.
I would recommend KILL if engagement shows no lift (<5%) in weeks 3-6, user satisfaction doesn’t improve, or DAU declines >1%.
How to Excel in This Case
1. Recognize this is a feature launch decision, not optimization: Unlike testing to increase revenue on existing features, you’re validating whether a new interaction pattern should exist. Your metrics need to include satisfaction and quality, not just engagement volume. Show you understand the difference.
2. Think about unintended consequences: The best candidates I’ve interviewed bring up risks like “What if Angry reactions create negative spirals?” or “What if creators stop posting when they get negative reactions?” This shows product judgment beyond just A/B testing mechanics.
3. Balance multiple stakeholders: There are at least three constituencies here:
- Users consuming content (do Reactions help them express?)
- Content creators (do they feel good about receiving varied reactions?)
- Facebook (does this increase engagement sustainably?)
Great answers acknowledge you need to optimize for all three.
Practice This Case
Want to try this A/B testing case yourself with an AI interviewer that challenges your experimental design and tests whether you can balance engagement with user experience?
Practice here: PM Interview: A/B Testing - Facebook Reactions Rollout
The AI interviewer will push you on your handling of novelty effects, challenge your metric choices, and test whether you can think about unintended consequences—just like a real Facebook PM would.
Further Reading
Explore more A/B testing resources I’ve created:
- A/B Testing: Facebook Ads Revenue - Newsletter on A/B testing for revenue optimization
- PM Interview Coach: A/B Testing - Master A/B testing questions in PM interviews with an expert AI coach
- A/B Testing: Google Homepage - Another AI scenario on A/B testing to practice
PM Tool of the Week: Riverside FM
As PMs, we’re increasingly expected to create content—whether it’s sharing product insights on podcasts, recording customer interviews, or hosting internal knowledge-sharing sessions. This week, I’m sharing Riverside FM - a tool I’ve been using lately that’s changed how I think about podcast and video recording.
Here’s why I like it:
-
Real simplicity to get started: Invite your guests with a link, they join from their browser (no downloads), and you’re recording in minutes. The onboarding is so smooth that even non-technical guests have zero friction.
-
AI features that just work: Automatic noise removal, filler word cleanup, and even AI-powered editing. The quality improvement is noticeable without any manual audio engineering on your part.
-
Generous free tier: You can actually create quality content without paying anything upfront. Perfect for testing whether podcasting or video content makes sense for your product or personal brand.
-
Output quality is surprisingly great: The final audio and video quality rivals much more complex setups. I’ve recorded interviews that sounded professionally produced without any post-production work.
If you’re thinking about starting a podcast, recording user interviews for research, or creating video content for your product—this is the easiest way to start. The barrier to entry is incredibly low.
If you try it out and create something, send me the link! I’d love to see what you make.
What would you do differently in testing Reactions? What metrics would you prioritize? Hit reply—I’m especially curious how people would handle the content creator concern about negative reactions!
About PM Interview Prep Weekly
Every Monday, get one complete PM case study with:
- Detailed solution walkthrough from an ex-Google PM perspective
- AI interview partner to practice with
- Insights on what interviewers actually look for
- Real examples from FAANG interviews
No fluff. No outdated advice. Just practical prep that works.
— Ajitesh
CEO & Co-founder, Tough Tongue AI
Ex-Google PM (Gemini)
LinkedIn | Twitter