Estimation Question: Google Photos Storage Capacity
Welcome to the seventh edition of PM Interview Prep Weekly! I’m Ajitesh, and this week we’re tackling estimation questions.
The Context
Estimation questions test a PM’s analytical skills and ability to structure ambiguous problems. PMs frequently need to make product decisions with limited information and data.
The reality is that estimates in the PM world aren’t very different from what candidates face in interviews—product managers often find themselves with just 10 minutes before a meeting to estimate market size or next year’s usage. Whether you’re budgeting for infrastructure, pitching a new feature, or projecting financial outcomes, the basic approach remains the same: break problems down, leverage available data, aggregate sensibly, and set proper expectations around the estimate’s certainty.
Where things differ is the depth of the exercise. Financial planning done ahead of the annual cycle involves spending weeks with other teams, doing research, collecting data, making refined assumptions, and validating them thoroughly. But if something comes up 10 minutes before a meeting, you’re doing back-of-the-envelope calculations with explicit assumptions that you’ll validate later if you get time. The PM interview experience feels similar to this latter scenario—we have limited time, we make clear assumptions, and we specify what we’d do better with more resources.
At Google, I regularly had to estimate everything from infrastructure costs for new features to potential user adoption rates—often with a VP waiting for answers. It’s fascinating that the approach I used there isn’t very different from what we’ll discuss in this newsletter today.
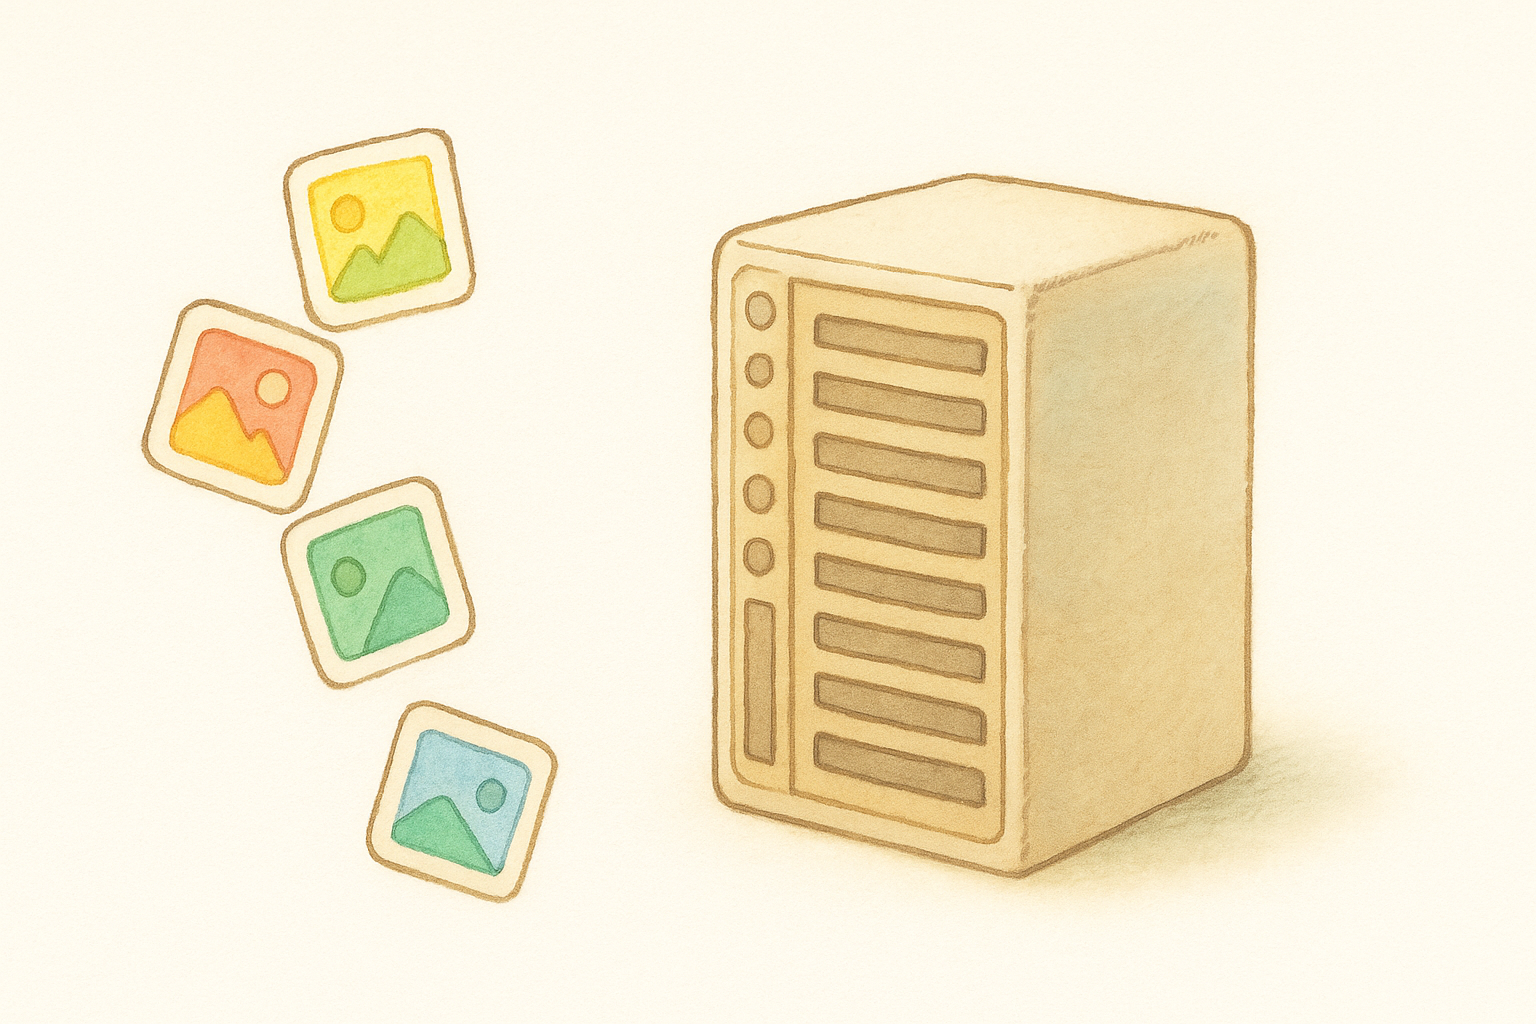
Today’s case is as real as it gets. Google Photos stores trillions of photos and videos from over a billion users. The infrastructure costs run into billions of dollars annually. And someone has to estimate how much storage they’ll need next year.
The setup: Google Photos offers free and paid storage tiers to users globally, backing up their precious memories.
The question: How do you estimate something this massive with limited information?
Today, we’re diving deep into this estimation: Estimate the total storage space required for Google Photos globally.
My Learning About Estimation
Before we dive in, let me share three things I’ve learned about estimation as a PM that guides my approach to this question type.
1. Context Shapes Your Approach
The approach to estimation varies significantly depending on what’s at stake:
-
Budgeting: When preparing next year’s infrastructure budget, I’d err on the side of caution—assume high usage and plan accordingly. Better to have excess capacity than service outages. This is typically a lightweight exercise.
-
Product Pitches: Estimating market size or revenue for a new feature pitch requires medium to heavy analysis depending on impact. Any pricing change, for instance, gets heavy scrutiny due to revenue, legal, and PR risks.
-
Financial Commitments: When finance teams build projections that impact quarterly earnings calls, we exercise maximum caution. We validate every assumption, use bottom-up approaches, and intentionally set targets below expectations. Missing these numbers has real consequences.
Now, this isn’t directly applicable in interviews, but depending on the question, you might want to bring up this real-world insight at the end. For example, if it’s a financial-related estimation, you’d want to say “This is how I would’ve done it in real life”—be more diligent and look at the numbers. For general product usage estimations, you’d mention having other teams involved (e.g., design, engineering). This is a good place for your product experience and sense to shine through and differentiate you from the pack.
2. Social Selling of Estimation Early in my PM career, I was terrified of sharing estimates. Everything could be questioned! But after doing it a couple of times, I realized it’s not that scary.
Most people know it’s very hard to get a 100% accurate number—what they want is a ballpark figure. In real meetings, people often don’t poke holes at everything, though during interviews, interviewers may deliberately challenge your assumptions and ask cross-questions.
This can happen in real life too, especially if you have a challenging team or a tough manager. Here are a few strategies that help you get buy-in on your estimates:
-
Social selling of your numbers. My manager and I would do a roadshow before important meetings, speaking to every team that might have questions or a stake in the game. We’d explain our point of view—what we did and how we estimated—so they’d be on our side and we wouldn’t be caught off guard.
-
Validate with experts. Take your estimates to subject matter experts to validate your approach and get their questions. Let them poke holes in your logic so you’re prepared when the real questions come.
-
Be crystal clear about your assumptions and evidence. Document these clearly in your slides or spreadsheets. This is crucial because when someone questions a specific assumption, it’s generally easy to handle—it might just require a small follow-up. However, if someone raises a question that isn’t captured in your assumptions, it can undermine your entire model and spiral your work. That’s why it’s essential to catch potential questions early and localize them by clearly defining your assumptions.
3. Breaking down problems
There are several techniques you can use to break estimation problems into smaller, manageable pieces:
-
Formula-based: Break a problem down into its key units or dimensions and estimate those. For example, estimate price and quantity separately for revenue (price × quantity).
-
Segmentation-based: Divide broad populations into segments that can be estimated separately, then sum them up. For example, segment a city’s population by age groups.
-
Part-based (for cost or size estimation): To estimate the size of the Eiffel Tower, I would estimate the base, body, and top separately. Or to estimate the cost of rewriting a web application, I’d split it into planning, writing code, and testing.
-
Geography-based: Once you calculate for a particular geographical unit, you can extrapolate for the total market. For example, for most products, the world market is 4X the US market (in line with GDP proportions). World population is 20X the US, so if you know per capita consumption, you can extend it with some approximation.
Make sure you walk the interviewer through your rationale for breaking down the problem. It’s worth noting that breaking down further is only helpful when the parts are easier to approximate than the whole. Perhaps there’s a good proxy for certain parts or useful data points that you know.
In real life, breaking down problems also helps split the work and assign it to teams who can do a better job. For example, the Asia usage estimate will come from the Asia team. Or the cost estimate would come from Finance, who needs your product usage and infra consumption as input.
4. Estimation techniques
Once you’ve broken down the problem, you estimate for each part and then aggregate. Estimation techniques rely on turning the ambiguous into the quantifiable. Facts, analogies, and experiences structured logically can take you closer to a reasonable estimate.
Some useful techniques include:
-
Anchoring: Leverage factual data points to anchor estimates. For example, using city population to estimate the number of car seats in San Francisco. This provides a logical starting point grounded in reality. That’s why it’s helpful to keep some key numbers handy in your mental toolkit—things like iPhone market share, internet penetration rates, or major tech companies’ revenues. These become your go-to anchors that you can quickly reference and build upon during any estimation exercise.
-
Proxies: Find a related concept that’s easier to estimate. For example, it might be hard to estimate the total number of pumpkins grown in the US (huge land area, etc.), but it’s easier to estimate pumpkin consumption per year and add additional capacity to account for wastage and demand buffer.
-
Personal References: Draw upon individual experiences to inform estimates when data is limited, such as using your grocery spend to estimate the grocery market size in the US. However, you must acknowledge biases—like the size of your household versus the average US household size.
-
Benchmarking/Analogies: Compare to similar products, companies, or markets you know well. For instance, when Spotify entered India, you could estimate their potential by looking at Netflix’s penetration in India after similar timeframes. Or estimate Threads’ user base by comparing it to Instagram’s launch trajectory. While this is a valuable technique in real PM work, in interviews you can talk about benchmarking against comparable products to validate and refine your numbers after you’ve done the estimation—it’s an additional consideration that shows your real-world PM skills.
-
Triangulation: Use multiple methods to estimate the same thing, then see if they converge. If you get wildly different numbers, it’s a signal to dig deeper. For example, estimate Uber’s revenue both top-down (market size × share) and bottom-up (rides per day × average fare × cities). If they’re in the same ballpark, you’re probably on track.
-
Growth Rate Patterns: Apply known growth patterns from tech adoption curves. Consumer apps often follow predictable patterns—like the “rule of 40%” for SaaS (growth rate + profit margin should exceed 40%). Or use the classic S-curve for technology adoption. Most consumer tech products take 5-7 years to hit mainstream adoption after launch. In real PM work, this is often your starting point. In interviews, save this for when they ask about additional considerations—it shows you understand how products actually evolve in the market.
-
Power Laws/Pareto Distributions: Many tech products follow power law distributions where a small percentage drives most of the value. The 80/20 rule is everywhere—20% of users generate 80% of revenue, 1% of users create 90% of content (the “1% rule”), top 10% of queries drive 50% of search volume. For example, when estimating YouTube’s storage needs, remember that 0.1% of creators probably generate 50% of the content. Or for marketplace GMV, the top 20% of sellers often drive 80% of sales.
-
Historical Data/Parametric Estimation: In real life, this is probably the most common approach for established products. You take last year’s numbers and project forward based on growth trends. For instance, if Google Photos had 300 EB last year and is growing 30% annually, you’d estimate 390 EB this year. This works great when you have reliable historical data and consistent patterns. In interviews, you can mention this as how you’d refine your estimate—“I’d look at last quarter’s actual usage and extrapolate based on our growth rate.”
For me, personal reference is the last resort in both interviews and real life. It’s the easiest way to get questioned. To an extent, it’s mostly only useful for common consumer products where you don’t expect much variation from what you observe. In contrast, for enterprise use—like estimating demand for vector databases for GenAI—it’s hard to use personal reference unless you’re using LLMs or know the usage patterns of top firms in the GenAI space.
In real life, I’ve found that combining 2-3 of these techniques gives you the most defensible estimate. Start with historical data if you have it, use anchoring or proxies to fill gaps, then triangulate with a different method to validate. This multi-pronged approach not only improves accuracy but also makes it easier to defend your numbers when stakeholders inevitably challenge them.
Approach to Solving Estimation Questions
I follow a simple 5-step approach that works both in interviews and real PM work:
-
Clarify the Requirements: Get specific on what needs to be estimated. I often see candidates miss critical details—enterprise versus consumer market, geography restrictions (global vs US only), time horizon, etc. These specifics can change your answer by orders of magnitude, so nail them down first.
-
Break Down and Explain: Decompose into manageable components using the techniques I covered in the previous section (formula-based, segmentation, part-based, geography-based). Walk the interviewer through your rationale for the breakdown. Remember, breaking down further is only helpful when the parts are easier to approximate than the whole.
-
Perform Estimation: Calculate each component using the techniques from the previous section (anchoring, proxies, benchmarking, triangulation, etc.). Then aggregate your results. This is where having key numbers in your mental toolkit really pays off—things like population figures, market sizes, and tech adoption rates.
-
Sanity Check: Validate your result makes sense using two methods:
- Order of magnitude check: Does the scale feel right? If you estimate 1 trillion pumpkins produced in the US yearly, that’s ~3,000 per person—clearly off by 100x.
- Compare to known benchmarks: For example, sanity check AirPods sales against iPhone sales (a much easier number to calculate and remember).
-
Communicate Uncertainties: Share your confidence level, key risks, and biggest assumptions. Mention how you’d refine this with more time—surveys, market research, benchmarking against similar products. This shows maturity and real-world thinking.
Key Numbers to Keep Handy
Having a mental toolkit of numbers is crucial for quick estimation. Here’s what I always keep ready:
Population & Demographics:
- World: 8B | US: 300M (30% urban, 55% suburban, 15% rural)
- US working population: 150M | California: 40M
- Average US household: 3 people | Life expectancy: 70 years
Economy:
- US GDP: $23T | World GDP: $100T
- US median household income: $70K
- Top 10% US income: $350K | Bottom 10%: $10K
Tech & Internet:
- Internet penetration: World 60%, US 90%
- US smartphone penetration: 80%
- iPhone: 50% of US market, 30% of world | Cost: ~$1,000
- Google has 9 products with 1B+ users
- Facebook: 3B MAU, 2B DAU
Storage & Data:
- Average smartphone photo: 3MB | DSLR photo: 10-20MB
- 5-min video (720p): 75MB | 1-hour show (1080p): 1.5GB | 2-hour movie (4K): 15-20GB
- Cloud storage cost: $0.02/GB/month
Tech Company Revenues:
- Google: $300B | Apple: $400B | Amazon: $550B
These numbers become your anchors and help you quickly validate estimates. The key is keeping them approximate and easy to remember—you’re aiming for the right order of magnitude, not perfect precision.
Let me show you how this works with Google Photos.
The Case
Interviewer: “Estimate the total storage space required for Google Photos globally.”
My Solution Using the 5-Step Framework
Step 1: Clarify the Requirements (2-3 minutes)
I typically start by stating my understanding of the product. With Google Photos being so well-known, I’d probably skip this, but for less familiar products, I’d say something like:
“My understanding is that Google Photos is a photo sharing and storage service that automatically backs up device photos. It indexes content to group related pictures into libraries, generates videos and animations automatically, and applies ML for search and organization. Being a reliable storage service, it likely maintains redundant copies across data centers with robust backup mechanisms.”
Now, let me clarify what we’re estimating:
Critical clarification: “Are we estimating the current total accumulated storage, or just this year’s uploads?”
This is THE most important question. The difference is massive—accumulated storage over 10 years versus one year’s worth could be 10× different.
(Interviewer: “Good clarifications. We want the total accumulated storage including all technical requirements.”)
Other clarifying questions:
- “Include both photos and videos?” → Yes, both
- “Original quality and compressed versions?” → All quality tiers users choose
- “Should I include technical overhead like redundancy?” → Yes, include operational needs
- “Global, not just US?” → Correct, global scale
Assumptions: Global scale, all photos & videos ever uploaded, 3× redundancy, +25% derived data (thumbnails, search features), +20% growth buffer
Step 2: Break Down and Explain Your Approach (3-4 minutes)
I’d ask for 30-60 seconds to think about the best way to break down this problem. This pause shows thoughtfulness—don’t jump straight into calculations.
The key here is to walk the interviewer through your approach before diving into numbers. If they’re not on board with your structure, they’ll get lost in the details later. I’d clearly write out my formula and explain each component:
I’ll use a formula-based approach:
Total Storage = Number of Users × Average Accumulated Content per User × Storage Sizes × Technical Multipliers
Here’s how I’ll break this down:
- User base - Start with Android/iOS anchors
- Content volume - Segment users by behavior and tenure (critical!)
- Storage sizes - Photos vs videos (videos dominate)
- Technical multipliers - Redundancy, derived data, growth buffer
Step 3: Perform Estimation (15-20 minutes)
This is where you’ll spend the bulk of your time. Remember those techniques we discussed? Now’s when you use them.
A few key things I do here:
- State your sources clearly - Always say where your numbers come from (anchor, proxy, benchmark)
- Round aggressively - Use whole numbers to speed up calculations and help the interviewer follow
- Simplify as you go - Don’t get lost in unnecessary precision when it doesn’t add value
The goal is to make it easy for both you and the interviewer to follow along. You don’t want to get bogged down in details that don’t matter.
User Base Calculation
Starting with anchors I know:
- Google has ~2B Android users globally
- Not all Android users use Photos—let’s say 65% adoption rate
- That gives us 1.3B Android Photos users
- iOS users also use Google Photos—harder to estimate but significant
- iPhone has ~1B users globally, maybe 30% use Google Photos
- That’s another 300M users
- Total: ~1.5B Google Photos users globally
Content Volume—The Critical Calculation
Let’s calculate from daily behavior, then multiply by tenure:
Power Users (20% of users = 300M people)
- These are parents, photographers, travel enthusiasts
- They’ve been using Photos for 5+ years on average
- Daily usage: ~15 photos/day + 2 short videos/day
- Annual: 15 × 365 = 5,475 photos/year
- Over 5 years: 5,475 × 5 = 27,375 photos
- But people delete duplicates, blurry shots—let’s say they keep 90%
- Final: ~25,000 photos accumulated
- Videos: 2 × 365 × 5 = 3,650, keep 30% = ~1,200 videos
Mainstream Users (30% of users = 450M people)
- Regular users, moderate photo takers
- Active for 3-4 years on average
- Daily usage: ~5 photos/day + 0.3 videos/day
- Calculate similarly: 5 × 365 × 3.5 years × 90% retention
- Final: ~6,000 photos, 300 videos accumulated
Casual Users (50% of users = 750M people)
- Occasional usage, mostly receive shared photos
- Active for 2 years, sporadic
- Maybe 1-2 photos/day when active
- Final: ~1,000 photos, 30 videos accumulated
Weighted Average Content per User:
- Photos: (0.2×25,000) + (0.3×6,000) + (0.5×1,000) = 7,300 photos
- Videos: (0.2×1,200) + (0.3×300) + (0.5×30) = 345 videos
Storage Sizes
Photos:
- Modern phones shoot 12MP photos = 3-5MB each
- Mix of original and compressed across users
- Average: 3MB per photo
Videos (the hidden multiplier!):
- This is critical—videos are HUGE
- 1080p: ~150MB per minute
- 4K: ~350MB per minute
- Average clip length: 30-60 seconds
- Mix of quality levels, let’s assume 50/50 split of 1080p/4K
- Average: 110MB per 40-second video
Calculate Raw Storage
Per User:
- Photos: 7,300 × 3MB = 21.9GB ≈ 22GB
- Videos: 345 × 110MB = 37.95GB ≈ 38GB
- Total per user: 60GB accumulated
This feels right—I know many people who’ve hit their 15GB free tier and pay for Google One.
Global Raw Storage: 1.5B users × 60GB = 90,000,000 GB = 90,000 PB = 90 Exabytes (EB)
Technical Multipliers
- Redundancy: 3× for reliability across data centers
- Derived data: +25% for thumbnails, search indices, ML embeddings
- Growth buffer: +20% for next year’s capacity
Total multiplier: 3 × 1.25 × 1.2 = 4.5×
Final Storage Requirement: 90 EB × 4.5 = ~405 EB
Step 4: Sanity Check (2-3 minutes)
This part has to be quick. Don’t spend too much time here—just show you can validate your numbers using what you know.
My approach: I imagine myself as the interviewer. How would I check if this makes sense? This gives me a few quick validation methods using proxies and order-of-magnitude checks.
Important: If something looks really off, do explain why it might be that way or provide a correction.
Let me validate this estimate:
Order of magnitude check:
- 400 Exabytes is “hundreds of exabytes”—sounds right for Google scale
- For context, the entire internet is estimated at several thousand exabytes
Per-user reality check:
- 60GB per user accumulated over years
- Many users exceed the 15GB free tier → Google One subscriptions
- Power users definitely have 100GB+ → the premium tiers make sense
Cost validation:
- At $0.02/GB/month for cloud storage
- 405 EB = 405 billion GB × $0.02 = $8-9B/year in storage costs
- That’s substantial but feasible for Google’s scale
Step 5: Communicate Uncertainties (2-3 minutes)
This is where you showcase your real-world PM experience and initiative. Experienced PMs (or those with good product sense) really shine here.
The key: Step out of the theoretical case and think through a real-world lens. What could go wrong? If you were actually doing this at work, what would bother you?
Think about:
- Team dynamics and getting buy-in on your assumptions
- Uncertainty in historical data
- Flaws in using proxies
- What you’d do differently with more time and resources
Show the interviewer you understand the difference between interview math and real-world complexity.
Key sensitivities:
- Video dominance: If 4K becomes universal, storage could double in 2-3 years
- Retention behavior: Do users delete old content or keep everything forever?
- Regional differences: Users in emerging markets might have different usage patterns
- AI features: New AI capabilities might generate even more derived data
What I’d validate with more time:
- Survey actual photo/video counts from a user sample
- Analyze deletion rates and patterns
- Study the shift from photo-centric to video-centric behavior
- Review regional differences in quality preferences
Confidence level: I’m confident we’re in the right order of magnitude (hundreds of exabytes). The exact number could vary by ±30% based on user behavior assumptions.
Common Pitfalls to Avoid
Calculating Annual Instead of Total
The biggest mistake is estimating one year’s uploads instead of accumulated storage. Always clarify timeframe first.
Missing the Dominant Factor
In storage estimates, video is often 10x larger than photos per unit. In network estimates, peak hours matter more than averages. Always identify what drives the bulk of your estimate.
Forgetting Technical Reality
Raw storage is just the beginning. Redundancy, backups, and derived data can multiply your needs by 3-5x. Include these operational requirements.
Using Only Averages
Real-world usage follows power laws. Segment your users—it makes your estimate more realistic and shows business acumen.
Practice This Case
Want to practice this estimation case with an AI interviewer that challenges your assumptions and helps solve it the right way?
Practice here: PM Interview: Google Photos Storage Estimation
The AI interviewer will probe your logic, test whether you can build up from daily usage, and ensure you don’t miss the technical multiplier—just like a real Google interviewer would.
Further Reading
Explore more estimation question resources I’ve created:
- PM Interview - Estimation Coach
- Estimation: Self-driving cars in US
- Estimation: Airbnb Revenue
- Estimation: Gmail QPS
- Estimation: Shampoo Consumption
- Complete Collection of AI conducted PM Interviews
PM Tool of the Week: v0 from Vercel
This week, I’m sharing v0 from Vercel - useful for PMs who want to quickly prototype and build UIs.
“Vibe coding” is becoming an essential PM skill. Whether you’re creating realistic prototypes for user research, getting stakeholder buy-in, or showcasing your ability to build AI products in interviews, vibe coding skills can be of great help.
Here’s why I love it:
1. High-quality UI out of the box They use shadcn/ui components (which we also use at Tough Tongue AI), giving everything a polished, professional feel without any design work.
2. Instant deployment Being built on Vercel’s infrastructure means you can deploy, add domains, and share with others in seconds. It’s one of the fastest ways to get a frontend live.
3. Great inspiration library Their discover section is full of examples, and their CEO Guillermo is fantastic at frontend—follow him on Twitter for constant inspiration and tips.
I’ve been using v0 to quickly test product concepts and build demos for stakeholder meetings. For example, this one on PM Interviews. It’s particularly powerful for AI PM roles where you need to demonstrate that you can actually build and understand the products you’re managing.
Trying out v0 for your prototypes? Hit reply and share what you build—I’d love to see it!
How would you approach the Google Photos estimation? What factors would you consider most critical? Reply and let me know—I learn something new from every approach!
About PM Interview Prep Weekly
Every week, you’ll get:
- One complete PM case study with detailed solution walkthrough
- An AI interview partner link to practice that exact case
- What’s new in PM tools, frameworks, and recruiting trends
No fluff. No outdated advice. Just practical prep that works.
— Ajitesh
CEO & Co-founder, Tough Tongue AI
Ex-Google PM (Gemini)
LinkedIn | Twitter